In my first blog post I managed to get my Arduino Uno to get temperature and humidity readings using a DHT11. Because my Uno has Wifi support, we managed to obtain an IP address from my local network and POST the temperature and humidity reading to a public server, httpbin.org. To secure our communication we switched from plain HTTP to HTTPS Client. And we even managed to see the reply from httpbin.org that contained our POST data and http headers.
In my second blog post we managed to build a C# Web API from scratch by installed Visual Studio Community edition and the Azure Cosmos DB emulator. We used the Cosmos DB emulator as our repository to save and retrieve readings. We then went on to create a C# Web API that accepts temperature and humidity log POSTs and can see them using GET. Along the way we learnt about the Repository pattern and Dependency Injection, two good programming principles to have under your belt. It will make switching been Azure Cosmos DB emulator and any other repository very easy in the future.
In my third blog post we managed to build an Angular 12 project from scratch by install Visual Studio Code, NPM, Angular CLI and D3.js. We covered quiet a few Angular CLI commands; to create a new Angular project, new Angular class, new Angular service and new Angular component. We setup our service with some fake temperature and humidity reading, so we could get our Temperature UI up and running quickly and not depend on our Web API just yet. And we managed to plot two cool bar graphs using D3.js.
In this blog post we are going to connect the 3 pieces together. So we should be able to POST a new temperature reading from our DHT11 sensor, connected to our Arduino Uno via our Wifi to our C# Web API. Our Web API should then save the reading to Azure Cosmos DB emulator. Then our Angular service will GET the latest 30 reading from our C# Web API and present them in a colourful graph for us to analyse.
How to POST temperature and humidity reading from Arduino Uno to our Web API?
Let’s start off by running our C# Web API in Visual Studio using IIS Express. This is so, when we start POSTing temperature and humidity reading from our Arduino Uno, our C# Web API is ready to collect them. If you have stopped your Azure Cosmos DB emulator, now is a good time to start it up again. To do this, just search for “Azure Cosmos DB emulator” and open it, the little Cosmos DB icon should appear in your task bar
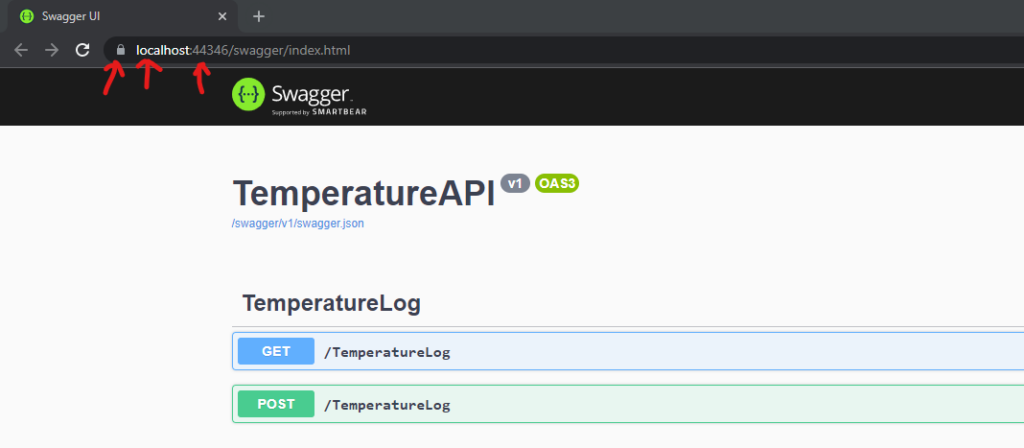
Hopefully you have your C# Web API up and running. When the swagger page comes up, make a note of the port number. In my case it is 44346. Also note the server address “localhost” and the little padlock, which means the site is using HTTPS. Also make a note of the POST URL, in our case it is ‘/TemperatureLog’
Connect up your Arduino Uno. If you had disconnected it and switched off your Arduino, make sure to start your Arduino Agent again and select the COM port from the dropdown list in the Online editor.
Now to update our settings, head over to the secrets tab and update the SERVERADDRESS to “localhost”. Update the SERVERPORT with the port that Visual Studio opened the Swagger page with. And update the POSTURL with our temperature API POST URL, which is ‘/TemperatureLog’. Your settings should look similar to this

When the code gets deployed, switch over to the Monitor tab

Status code of -2 … our Arduino Uno is not able to POST to our Web API? It was able to POST our readings to a public API just a few seconds ago, but our reading are not reaching our Web API. This is because our Web API is running on our laptop using IIS Express and not a public server. We have to make 5 small adjustments. If our Web API was running on a public server on the internet, we would not need to do these adjustments. I’ll get to hosting our Web API in Azure Cloud and make it public facing in a future blog post. For now lets get it working with IIS express on our laptops
1. Use laptop IP address instead of localhost
“localhost” address has a special meaning behind it, it means “this computer”. When we put “localhost” as the server address in our Arduino Secrets, it will try to send the reading back to itself, which is not what we want. The easiest way to fix this is to run ‘ipconfig’ in the command prompt on your laptop and try to locate your laptop’s IP address.

Make sure you use the IPv4 Address of the adapter that your laptop and Arduino Uno are connected to. They have to be on the same network otherwise they will not be able to speak to one another. I have a few adapters and had to locate my Wi-Fi adapter. Your IPv4 Address should hopefully start with 192.168.x.x or 172.x.x.x or 10.x.x.x but could change depending on our router settings. Make a note of your “IPv4 address”. In my case my laptop’s IPv4 address is 192.168.1.30 and my Arduino Uno Wifi’s IPv4 address is 192.168.1.35
2. Locate the HTTP Port number
When we runs our C# Web API code in Visual Studio, VS uses IIS Express to make our Web API available to us. IIS Express was not designed to be a public server, but emulate a lot of its behaviours so we can see our code in action. If not for IIS Express, we would need to install IIS, the full version. For now let try to work with IIS Express and save our reading by using the HTTP port by doing a few small adjustments
To locate the HTTP port number, right click on your C# Web API Project and select Properties

Switch over to the “Debug” tab and locate and scroll down till you see Web Server Settings. Locate “App URL”, this is the HTTP address of your website. Make a note of the port number. In my case it is 30521. You can also see the HTTPS Port and other interest Server Settings that VS uses to host our website

3. Update IIS Express binding in applicationhost.config
Because IIS Express is not designed to work on the internet, it is only looking at GET and POST with localhost in the URL. We need to tell it we are going to use our IPv4 address to GET and POST too to our Web API. To do this we need to update the bindings in a configuration file that IIS Express uses
Open your project folder and you should see a “.vs” folder. If you don’t see, it is because it is a hidden folder. Either turn on show all hidden files and folders to locate it or just type it into the folder location like this:

You should see a “TemperatureAPI” folder again, go into it. And into “config” folder and open “applicationhost.config”. Search for “<site name=”TemperatureAPI”” and you should see some binding under it. Duplicate the http binding and replace “localhost” with your IPv4 address. Hopefully your end result looks like this:

4. Run Visual Studio as Administrator
In order to get IIS Express to pick up our custom binding we need to run VS as Administrator. If we don’t do this, VS will tell us “Unable to connect to web server ‘IIS Express'”

To run Visual Studio as Administrator. Close all your Visual Studio instances. Search for Visual Studio and click on “Run as Administrator” instead of “Open” and then select the TemperatureAPI project

This time when you run your project in IIS Express, you should see the HTTPS swagger page and be able to browse to or Web API using our new HTTP binding

5. Open the HTTP Web API port on your firewall
In order to protect our laptop from malicious programmes and people on the internet, most of our computers have a software called Firewall. This is normal and a very good software. But, it also blocks our Arduino Uno from accessing our Web API because we are using a port that is not the default HTTP or HTTPS port. The default HTTP port is 80 and default HTTPS port is 443. My Web API is listening on port 30521, so I need to tell my firewall it is ok for port 30521 to be accessible whilst I do my testing and check that my Arduino Uno can POST to my Web API
I’m using the Firewall that Windows 10 gives us out of the box. If you have another firewall please check the instructions to open a port. In Windows 10, search for Firewall and open it. Then click on “Advanced settings” on the left. This should bring up the “Windows Defender Firewall with Advanced Security”. Click on “Inbound Rules” on the left and then “New Rules…” on the right. The “New Inbound Rule Wizard” will come up. Select Port and click the Next button

Leave “TCP” and enter your Web API Port number. In my case it is 30521 and click Next”

On Action select “Allow the connection” and click next

Make sure the rule applies to all profiles and click next

On the Name page enter a name that is meaningful and easy to remember so we can de-active this firewall rule when we are done with our testing. I gave it the name “Arduino TemperatureAPI 30521” and click “Finish”

To further secure our new Firewall rule, locate our new Firewall rule in the Inbounds Rules list and open it. Got to the Scope tab and select “Remote IP addresses”, click on “Add…” and put your Arduino Uno’s Wifi IPv4 Address here and click “OK” and “Apply”. Your Arduino’s Wifi IPv4 address should appear in the Monitor tab in the Online Editor when your Arduino connects to your WiFi. Now our new Firewall rule will only allow traffic to port 30521 from this IPv4 address, thus reducing our exposure to malicious programmes and people on the internet. If your Arduino Uno’s WiFi address keeps on changing, consider using an IPv4 range instead of a single IPv4.

Updating Arduino Secrets to POST our readings from our Arduino Uno Wifi to our Web API?
Go through and update your Arduino Secrets with the Server Address of your laptop’s IPv4 Address. The Server Port will be you HTTP port and Post URL stays the same ‘/TemperatureLog’. Your settings should be similar to

And switch over to our Arduino sketch where our DHT11 code is, locate WiFiSSLClient to change it to WiFiClient, this should be on line 17. The rest of the code stays the same. Now click the “Upload and Save” button.
Vola! Now we are POSTing temperature and humidity reading from our Arduino Uno Wifi to our C# Web API. You should see Status Code: 200 in the Monitor output

And we can make a GET request to our Web API to see our saved readings too. Browse to “https://localhost:44346/temperaturelog” or “http://localhost:30521/temperaturelog” or even “http://192.168.1.30:30521/temperaturelog”

Few thinks we can notice, the device name is null and the timestamp field looks wrong. This is because the JSON data we are POSTing does not match the C# model property. To fix the device name let head over to our Arduino Editor and make a small change. Locate the postData string and change “name” to “deviceName” and click “Upload and Save”
For the timestamp, we need to identify where the date is going wrong. There are 2 places where we are working with timestamp. One when a new reading arrives, before we save it to Cosmos DB and second when someone makes a GET request and we get the reading our of Cosmos DB. We can easily tell which of the two is the issue by checking what is getting stored in Cosmos DB. Browse to our Cosmos DB emulator and lets see what is getting saved there
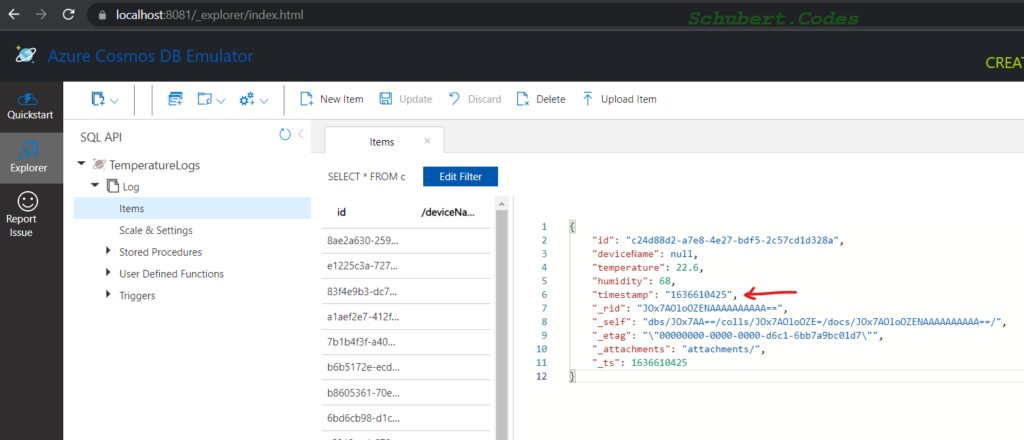
After looking through a few or our saved reading we can see that the timestamps are getting saved correct. Which means the issue is with the formatting when we give out the value. Head over to the C# Web API code and open the Temperature Log Controller class. We were formatting the date on line 32, lets update that. Our TemperatureLogController.cs should looks like
using Microsoft.AspNetCore.Mvc;
using System;
using System.Linq;
using System.Collections.Generic;
using System.Threading.Tasks;
using TemperatureAPI.Models;
using TemperatureAPI.Repository;
namespace TemperatureAPI.Controllers
{
    [ApiController]
    [Route("[controller]")]
    public class TemperatureLogController : ControllerBase
    {
        private readonly IRepository<TemperatureLog> _cosmosDbRepository;
        public TemperatureLogController(IRepository<TemperatureLog> cosmosDbRepository)
        {
            _cosmosDbRepository = cosmosDbRepository;
        }
        [HttpGet]
        public async Task<IEnumerable<TemperatureLog>> Get()
        {
            var results = await _cosmosDbRepository.GetItemsAsync("SELECT * FROM c ORDER BY c.timestamp DESC OFFSET 0 LIMIT 30");
            return results.OrderBy(r => r.Timestamp);
        }
        [HttpPost]
        public async Task<ActionResult> Post(TemperatureLog temperatureLog)
        {
            temperatureLog.Id = Guid.NewGuid().ToString();
            temperatureLog.Timestamp = DateTimeOffset.UtcNow.ToUnixTimeSeconds().ToString();
            await _cosmosDbRepository.AddItemAsync(temperatureLog);
            return Ok("Saved");
        }
    }
}
For our new code to take effect, we have to tell VS to stop. Click the stop button in the tool bar and then press the play in IIS Express button again

Eureka! Now we should start seeing our device name in the latest reading and the correct timestamps for all our readings

Update our Angular service to GET our real temperature and humidity readings from our Web API?
When we built our Angular service, we put some fake readings in there. This is so we could build the Graph independent of our Web API. We are finally going to connect these pieces so our real temperature and humidity reading will appear in the graph
Let start off by getting the HttpClient in our Angular service and we can do this via the constructor. HttpClient is code written by Angular to make HTTP calls in the background. We are going to leverage this package to call our Web API and get our readings. Your service should look like this after the update
import { Injectable } from '@angular/core';
import { Observable, of } from 'rxjs';
import { TemperatureLog } from '../models/temperature-log';
import { HttpClient } from '@angular/common/http';
@Injectable({
  providedIn: 'root'
})
export class TemperatureLogService {
  constructor(private httpClient: HttpClient) {
  }
  getTemperatureLogs() : Observable<TemperatureLog[]>{
    return this.httpClient.get<TemperatureLog[]>("https://localhost:44346/temperaturelog");
  }
}
The way we are passing HttpClient to our Service is another good example of Dependency Injection. Seeing as we are using Angular’s HttpClient we need to import it. Just like with any package we did not write, we need to import it. We do this in Angular by making an update in app.module.ts. Locate this file and update it, so it looks like the below
import { HttpClientModule } from '@angular/common/http';
import { NgModule } from '@angular/core';
import { BrowserModule } from '@angular/platform-browser';
import { AppRoutingModule } from './app-routing.module';
import { AppComponent } from './app.component';
import { BarGraphComponent } from './temperaturelog/bar-graph/bar-graph.component';
@NgModule({
  declarations: [
    AppComponent,
    BarGraphComponent
  ],
  imports: [
    BrowserModule,
    AppRoutingModule,
    HttpClientModule
  ],
  providers: [],
  bootstrap: [AppComponent]
})
export class AppModule { }
Now we should be able to run our Angular project i.e. “npm start” in the command prompt and browse to “http://localhost:4200/temperature-log-bar-graph” and hopefully we should see our graph with our latest temperature and humidity readings … well not yet, we have one more hurdle to get over, CORS!. You can open the debug window by pressing F12 in Chrome and see the CORS error in JavaScript

What is CORS and why are we seeing this now?
CORS is Cross-Origin Resource Sharing. It a mechanism that browsers uses to restrict other websites from calling our Web APIs. It is good because we can control who can call our Web API. Point to note, this is a check in modern browsers. This is why we could browse directly to our Web API and GET results but when our TemperatureUI website make the same GET via Chrome browser in the background, it got blocked by CORS.
In order to tell our browse it is ok for our Temperature UI website to call our Web API, we need to make an update in our Web API. The update is going to add a HTTP header to our GET result that is going to say allow any request from any website. We will lock this down in another post but for now lets allow any website. To do this, locate your Startup.cs and update it to the below, you can see we added CORS allows any origin on line 53
using Microsoft.AspNetCore.Builder;
using Microsoft.AspNetCore.Hosting;
using Microsoft.Azure.Cosmos;
using Microsoft.Extensions.Configuration;
using Microsoft.Extensions.DependencyInjection;
using Microsoft.Extensions.Hosting;
using Microsoft.OpenApi.Models;
using System.Threading.Tasks;
using TemperatureAPI.Models;
using TemperatureAPI.Repository;
using TemperatureAPI.Settings;
namespace TemperatureAPI
{
    public class Startup
    {
        public Startup(IConfiguration configuration)
        {
            Configuration = configuration;
        }
        public IConfiguration Configuration { get; }
        // This method gets called by the runtime. Use this method to add services to the container.
        public void ConfigureServices(IServiceCollection services)
        {
            services.AddOptions();
            services.Configure<CosmosDbSettings>(Configuration.GetSection("CosmosDb"));
            services.AddSingleton<CosmosClient>(InitializeCosmosClientInstanceAsync(Configuration.GetSection("CosmosDb")).GetAwaiter().GetResult());
            services.AddScoped<IRepository<TemperatureLog>, CosmosDBRepository>();
            services.AddControllers();
            services.AddSwaggerGen(c =>
            {
                c.SwaggerDoc("v1", new OpenApiInfo { Title = "TemperatureAPI", Version = "v1" });
            });
        }
        // This method gets called by the runtime. Use this method to configure the HTTP request pipeline.
        public void Configure(IApplicationBuilder app, IWebHostEnvironment env)
        {
            if (env.IsDevelopment())
            {
                app.UseDeveloperExceptionPage();
                app.UseSwagger();
                app.UseSwaggerUI(c => c.SwaggerEndpoint("/swagger/v1/swagger.json", "TemperatureAPI v1"));
            }
            app.UseRouting();
            app.UseAuthorization();
            app.UseCors(x => x.AllowAnyOrigin());
            app.UseEndpoints(endpoints =>
            {
                endpoints.MapControllers();
            });
        }
        private static async Task<CosmosClient> InitializeCosmosClientInstanceAsync(IConfigurationSection configurationSection)
        {
            string databaseName = configurationSection.GetSection("DatabaseName").Value;
            string containerName = configurationSection.GetSection("ContainerName").Value;
            string account = configurationSection.GetSection("Account").Value;
            string key = configurationSection.GetSection("Key").Value;
            CosmosClient client = new CosmosClient(account, key);
            DatabaseResponse database = await client.CreateDatabaseIfNotExistsAsync(databaseName);
            await database.Database.CreateContainerIfNotExistsAsync(containerName, "/deviceName");
            return client;
        }
    }
}
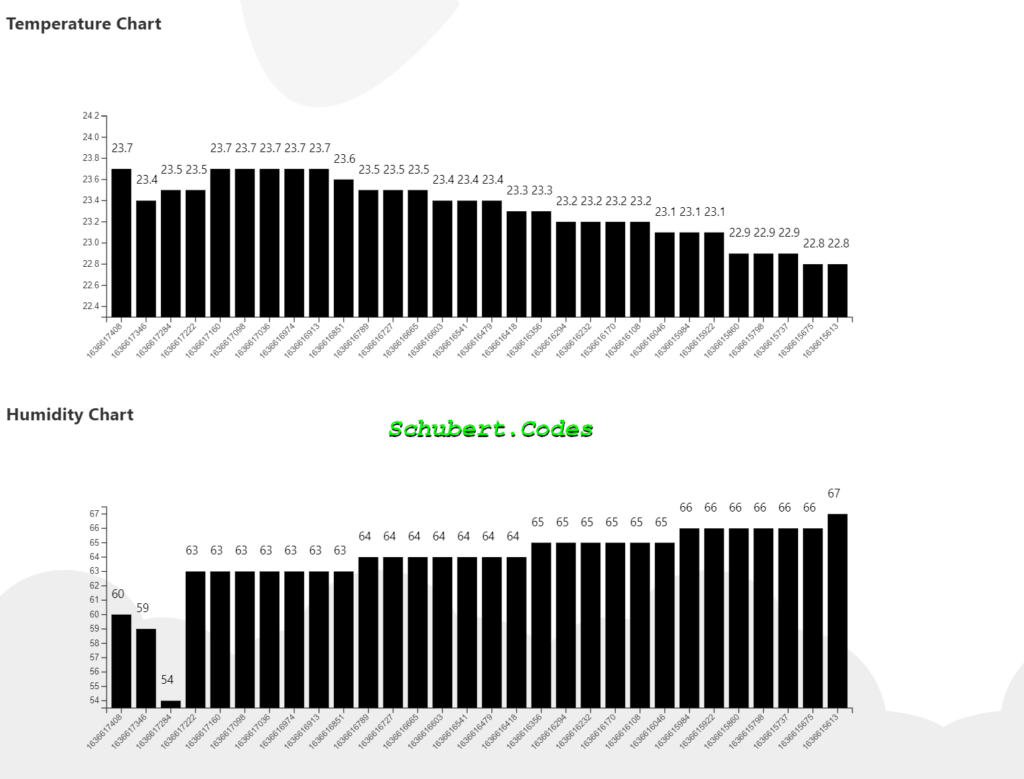
Now stop VS debugging by pressing the “Stop Debugging” button and again run it in IIS Express. And now browse to “http://localhost:4200/temperature-log-bar-graph” and scroll to the bottom … Success!!!
Adding colour to our charts and date formatting
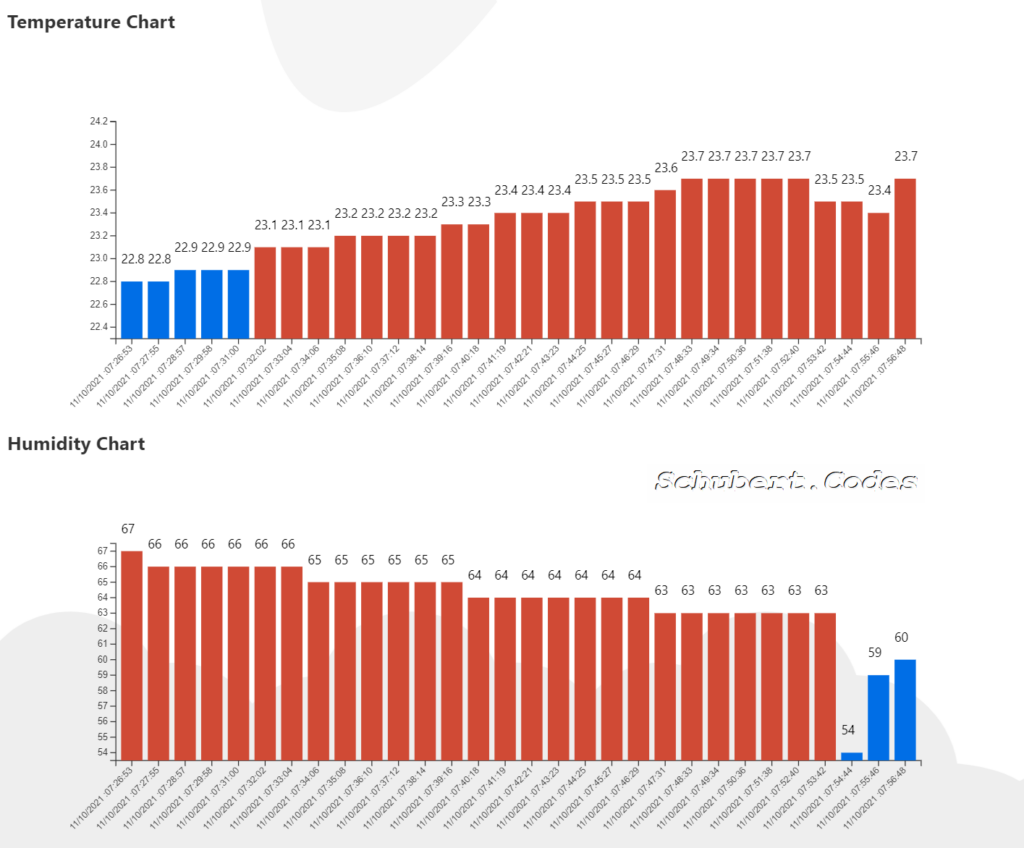
We live a colourful world, not black and white. So, lets try to give our graph some colour. If the temperature is above 23 degrees we will make the bar orange and if the temperature is under, we will make the bar blue. Similarly for the humidity, when it is above 60 we will make the bar orange and if the humidity is under, we will make the bar blue. Feel free to change these values to work with your temperature and humidity ranges.
The other change is to format the date, not everyone can understand what 1636617408 epoch date time means. To make it human readable, we are going to convert epoch date time back to a format we understand. You can locate this code in convertEpochDateTimeToString function. After we do these 2 updates your code should look like the below
import { Component, OnDestroy, OnInit } from '@angular/core';
import * as d3 from 'd3';
import { Subscription } from 'rxjs';
import { tap } from 'rxjs/operators'
import { TemperatureLog } from 'src/app/models/temperature-log';
import { TemperatureLogService } from 'src/app/services/temperature-log.service';
@Component({
  selector: 'app-bar-graph',
  templateUrl: './bar-graph.component.html',
  styleUrls: ['./bar-graph.component.css']
})
export class BarGraphComponent implements OnInit, OnDestroy {
  // A variable to keep our get temperature logs subscription
  getTemperatureLogsSubscription: Subscription | undefined;
  // A variable for the space around our graph
  private margin = 80;
  // A variable for the width of our graphs
  private width = 1050 - (this.margin * 2);
  // A variable for the height of our graphs
  private height = 400 - (this.margin * 2);
  // The bar graph component constructor
  // where we inject our TemperatureLogService
  constructor(private temperatureService: TemperatureLogService) {
  }
  // This code is run when our component start gluing our HTML
  ngOnInit(): void {
    // create the skeleton SVG for temperature and humidity graph
    // these SVGs will be used to draw our graphs
    let tempSVG = this.createSvg("temperature");
    let humiditySVG = this.createSvg("humidity");
    // We are calling our temperature service to get our temperature logs
    // and we are saving that subscription in a variables, so we can tell the browser to
    // free the memory space when we no longer need the data
    this.getTemperatureLogsSubscription = this.temperatureService.getTemperatureLogs()
    .pipe(
      // plot our temperature graph
      tap((logs) => this.drawBars(tempSVG, "temperature", logs)),
      // plot our humidity graph
      tap((logs) => this.drawBars(humiditySVG, "humidity", logs))
    ).subscribe();
  }
  // This code is run when our component is done and we no longer needed it
  ngOnDestroy(): void {
    // we are unsubscribing here to free up memory
    this.getTemperatureLogsSubscription?.unsubscribe();
  }
  // This code will create our blank SVG in our HTML
  private createSvg(type: string): d3.Selection<SVGGElement, unknown, HTMLElement, any> {
    return d3
      //find our figure HTML element using the type parameter
      .select(`figure#${type}`)
      // create a SVG HTML element inside of it
      .append("svg")
      // set the SVG's width
      .attr("width", this.width + (this.margin * 2))
      // set the SVG's height
      .attr("height", this.height + (this.margin * 2))
      // make a place to draw our graph
      // Just to clarify, we are going to draw our graph later when we get the data from our C# Web API
      // but we are making a place for it now. So right now we are making a HTML element called 'g'
      // inside our SVG which is inside our figure, the bars will get drawn here
      .append("g")
      // adjust the position of our graph in the SVG
      .attr("transform", "translate(" + this.margin + "," + this.margin + ")");
  }
  // This code will draw the bars in our graph
  private drawBars(svg : any, type: string, data: TemperatureLog[]): void {
    // D3.js is going to help us map our timestamps to the x-axis
    const x = d3.scaleBand()
      // we tell D3.js how much width we have for our graph
      .range([0, this.width])
      // we tell D3.js the timetamp values in our data, so it can adjust the width
      .domain(data.map((d : TemperatureLog) => d.timestamp.toString()))
      // leave a gap between the bars on the x-axis
      .padding(0.2);
    // Draw the x-axis on the SVG
    svg.append("g")
      // move our x-axis text down to the bottom of the graph
      .attr("transform", "translate(0," + this.height + ")")
      // call D3.js to get our x-axis values
      .call(d3.axisBottom(x).tickFormat((date: string, index: number) => this.convertEpochDateTimeToString(date)))
      // format the date from a number to a human readable format

      // select all our x-axis text
      .selectAll("text")
      // rotate them so they look cool
      .attr("transform", "translate(-10,0)rotate(-45)")
      // move the text even lower, so the whole value is visible
      .style("text-anchor", "end");
    // put all our reading of type parameter in an array called readings
    // so readings array will be filled with our temperature readings when we type is temperature
    // and readings array will be filled with our humidity readings when we type is humidity
    var readings = data.map(d => d[type]);
    // D3.js is going to help us map our reading to the y-axis
    const y = d3.scaleLinear()
      // we tell D3.js how much height we have for our graph
      .range([this.height, 0])
      // we tell D3.js the reading values in our data, so it can adjust the height
      .domain([Math.min(...readings) - 0.5, Math.max(...readings) + 0.5]);
    // Draw the Y-axis in the SVG
    svg.append("g")
      // call D3.js to get our y-axis values
      .call(d3.axisLeft(y));
    // Create and fill the bars
    svg.selectAll("bars")
      .data(data)
      .enter()
      .append("rect")
      .attr("x", (d : TemperatureLog) => x(d.timestamp.toString()))
      .attr("y", (d : TemperatureLog) => y(d[type]))
      .attr("width", x.bandwidth())
      .attr("height", (d: TemperatureLog) => this.height - y(d[type]))
      .attr("fill", (d: TemperatureLog) => {
        if(type === "temperature" && d[type] > 23) {
          return "#d04a35"
        }
        if(type === "humidity" && d[type] > 60 ) {
          return "#d04a35"
        }
        return "#006ee6";
      });
    // Put the reading above each bar, so it is easy to see the reading
    svg.selectAll("bars")
      .data(data)
      .enter()
      .append("text")
      .attr("x", (d : TemperatureLog) => x(d.timestamp.toString()))
      .attr("y", (d : TemperatureLog) => y(d[type]) - 20)
      .text((d: TemperatureLog) => d[type]);
  }
  convertEpochDateTimeToString(ticksInSecs: string) {
    var epochDateTimeAsInt = parseInt(ticksInSecs);
    var date = new Date(0); // The 0 there is the key, which sets the date to the epoch
    date.setUTCSeconds(epochDateTimeAsInt);
    return date.getDate() + "/" + date.getMonth() + "/" + date.getFullYear()
      + " :" + this.pad(date.getUTCHours().toString(), 2)
      + ":" + this.pad(date.getMinutes().toString(), 2)
      + ":" + this.pad(date.getSeconds().toString(), 2);
  }
  pad(n: string, width: number) {
    return n.length >= width ? n : new Array(width - n.length + 1).join('0') + n;
  }
}
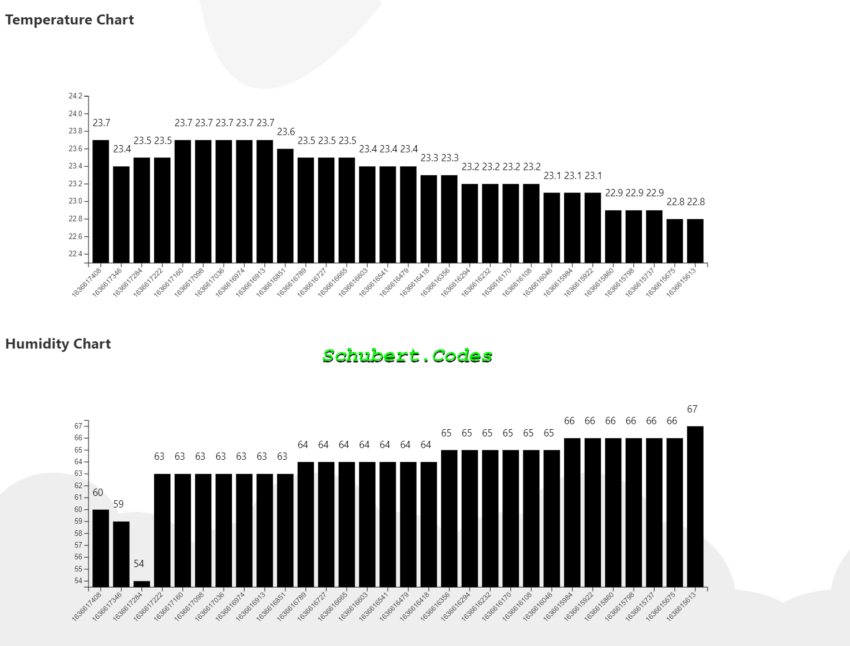
And our graphs should now look like this … cool right!
Final notes and additional improvements
We have come a long way, from getting some reading from our Arduino, to saving them in Cosmos DB, to plotting cool graphs. Don’t forget to pat yourself on the back if you have managed to follow along and get this far.
In the next blog post we are going to try to make our C# Web API available on the internet. Our Arduino Uno can POST our reading even when we close down Visual Studio and IIS Express or even when our laptop is off. We are going to dive into the world of Docker and packaging our code so it is easy to deploy in Azure Cloud and get a basic understanding of Azure Devops
A few points additional improvements that you can do:
1.Refresh the browse every minute using JavaScript, so the graph automatically gets updated
2.Gradient colour our graph, so we can have different colours from temperature between 19 and 20, 20 and 21, 21 and 22, etc
Till next time, Happy Coding!
Thanks for your blog, nice to read. Do not stop.
Saved as a favorite, I love your website!
I want to thank you for your assistance and this post. It’s been great.