In my last blog post, we managed to install Visual Studio Community edition and create a C# Temperature Log Web API from scratch. We also managed to install Azure Cosmos DB emulator on our laptop and got our Web API to save some test reading, we did this by using the Swagger page that loaded in our browser when we ran our Web API project in VS using IIS Express Server. We even managed to see our test readings in Azure Cosmos DB Explorer and using the GET method too. And looked into some good coding practices like Repository Pattern and Dependency Injection.
In this blog post we are going to install Visual Studio Code. VS Code is a lighter code editor and is good for coding JavaScript. It is quick to install, loads fast and has loads of cool features but not as much as the full Visual Studio that we installed in my last blog post. We will also install Node.js, NPM and Angular CLI. These will allow us to create a new angular project from scratch that can speak to our Web API in the background. It will get our temperature and humidity readings and plot cool bar graphs in our browser. We are going to use D3.js to plot the graphs, it is a well known library to manipulate data and visualise data in the browser. Don’t worry, these series of blogs are going to walk you through it step by step.
How to Install Visual Studio Code?
Visual Studio Code is a free editor that is optimised for building and debugging modern web and cloud application. We are going to use it to create our Angular application which uses typescript. Typescript is a strong typed programming language that builds on JavaScript. This just means our JavaScript is easier to read and follows some very good practices
1. The install file is a single executable file that can be found here
2. After you download the file, run the setup and you should see something like this. Please read and accept the agreement and click Next

3. As we can see VS Code only needs 304.1 MB of disk space. Click Next

Click Next a few times and you should get to the below screen. Make sure to select both the ‘Add “Open with Code” action to Windows Explorer …’ and click Next and Install to start the installation process

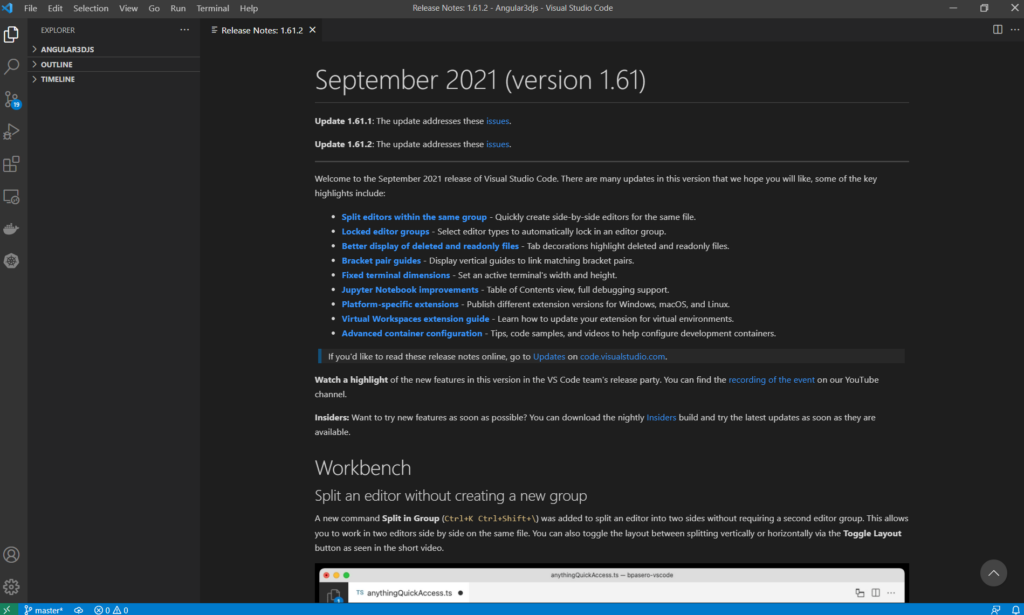
On the final install page, click Finish and Visual Studio Code should start up. As you can see I’ve got September 2021 (version 1.61) installed. Visual Studio Code is always being updated and improved, so if you have a later version, don’t worry, most of this blog should carry on as usual
How to install Node.js and NPM?
We are going to install Node.js and NPM in this section. We are only going to focus on the NPM part of the install here and look at Node.js in another blog post. NPM is the package manager for Node.js. We came across packages in my last post. Packages contain code that someone else has written that we can leverage in our project. This help us to get to our end code faster. There are lots of packages in NPM, like Math libraries, visual libraries like D3.js and styling libraries like Bootstrap, etc.
1. The install file is a single executable file that can be found here. Click on the version that say “Recommended for Most Users” and download it
2. After you download the file, run the setup and you should see the welcome screen. Click Next. Please read and accept the terms and click Next

Click Next a few more times till the install starts. You should see the install progress like this. Sit back and relax whilst the install takes place

Click Finish and the install should be done. To check that the install was successful, open your command prompt and run “node -v” to see what version of Node.js got installed. And run “npm -version” to see what version of NPM got installed

How to install the Angular CLI?
The Angular CLI is a command line tool that will allows us to create a new Angular project. We can even use it to create new Angular components and services which we will got to shortly. We are going to use NPM that we installed in the previous section to run one command. The command is mentioned on the Angular website. Just to make it easy, below is the command. So open your command prompt and run the below
npm install -g @angular/cliThe output from my install is below
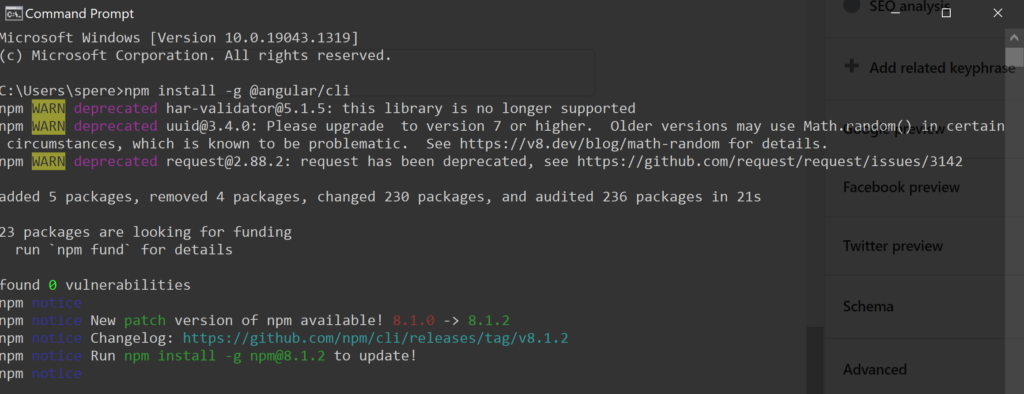
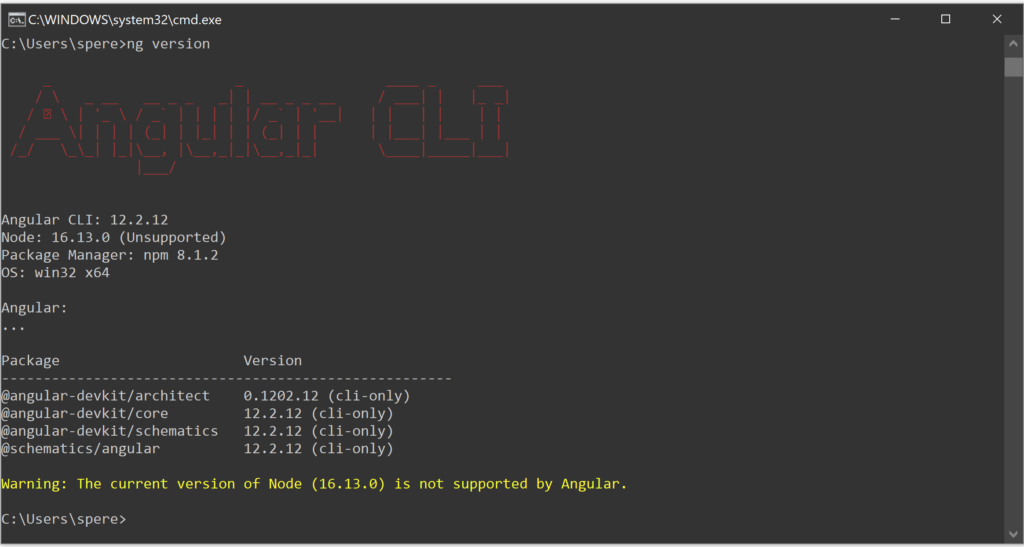
To make sure you install was successful, run “ng version” and you should get an output similar to the below. As you can see I have version 12.2.12 of Angular. If you see a higher version, don’t worry. Angular is constantly updating and improving the Angular CLI.
How to create a basic Angular project?
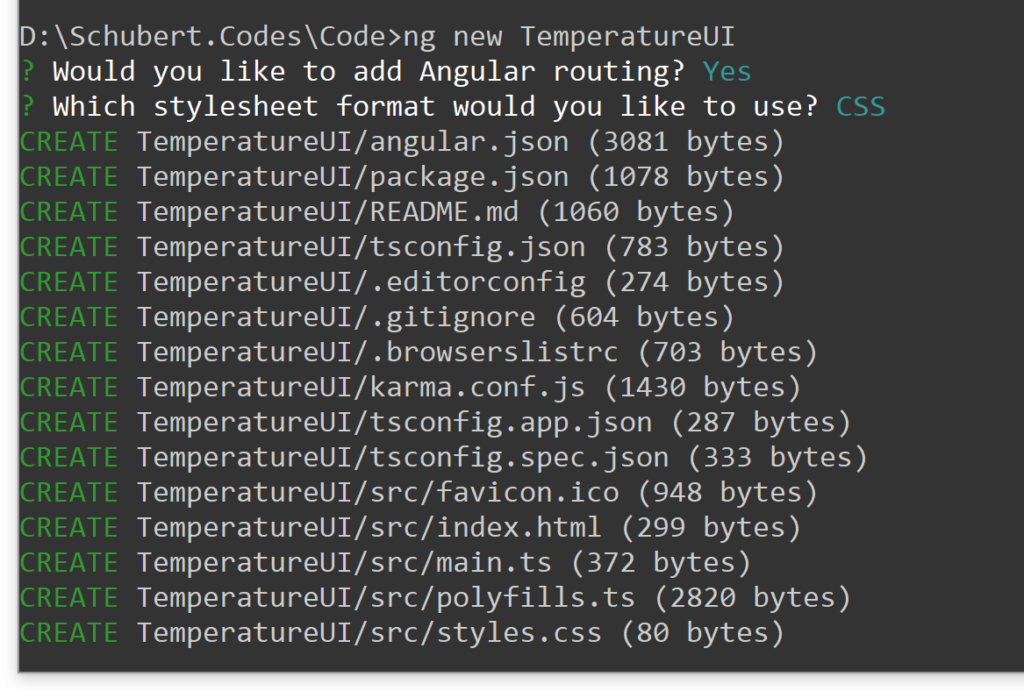
We are pretty much going to compile and look at the default website that Angular gives us out of the box when we create a new Angular project. To do we need to open the command prompt and get to the directory where we want to keep our code. In my case I have changed my directory to “D:\schubert.Codes\Code” and then ran one command
ng new TemperatureUIYour output should hopefully be similar to this. When asked “Would you like to add Angular routing?” type Yes. And when asked “Which stylesheet format would you like to use?” make sure CSS is selected and hit Enter. Then we can see Angular CLR create all the files we will need in our Temperature UI project
After the Angular CLI has finished creating our basic project. Change directory (cd) to our Temperature UI project and type one more command “npm start”. This should compile the default Angular 12 project and start-up the Angular Development Server on port 4200. It even tells us to browse to http://localhost:4200/
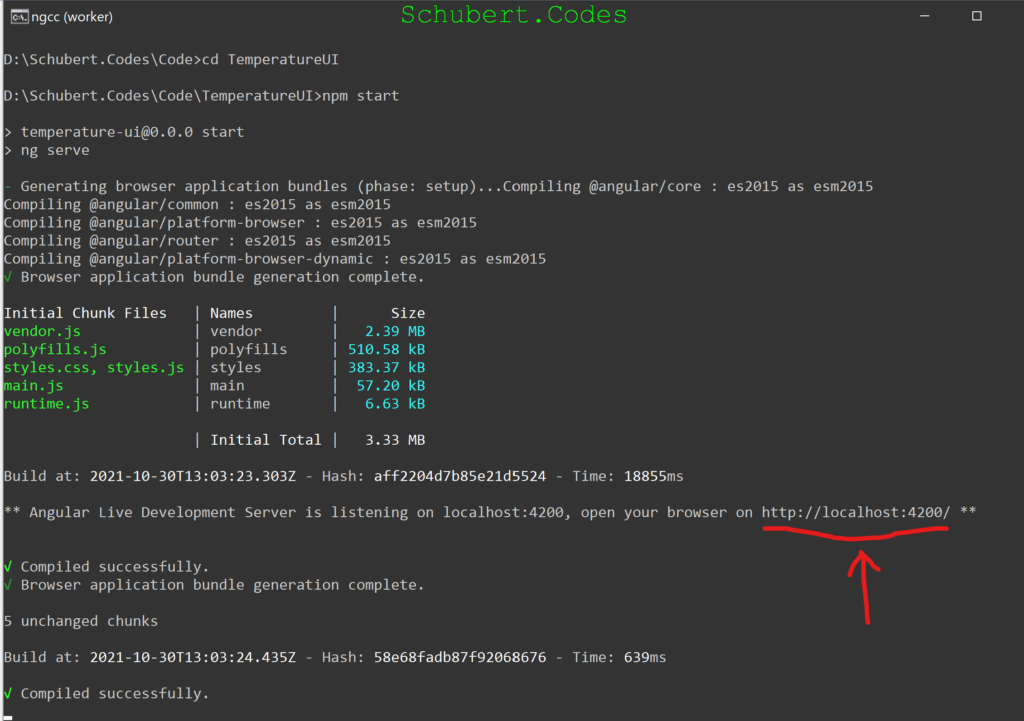
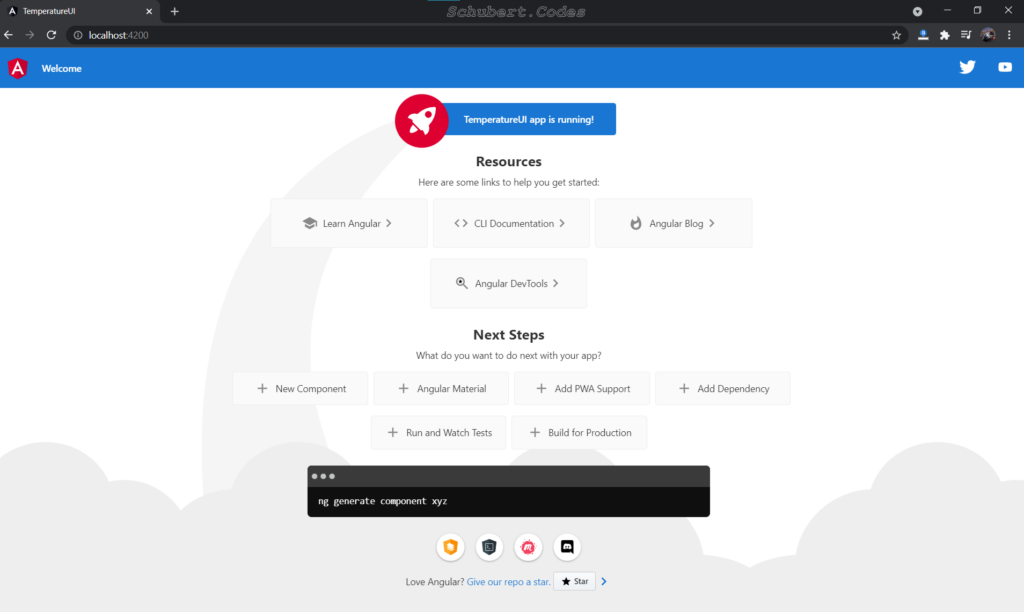
Vola! when we browse to http://localhost:4200, we should see our Temperature UI is up and running. It is the default Angular site up and running. By the end of this blog we should see a cool temperature and humidity graphs here
Stop the Angular Development Server by pressing CTRL + C in the terminal and now we can get started on the more exciting part of our project, plotting our graphs. To open our project in VS Code we need to run “code .” from the command prompt. This is so we can start doing some JavaScript / typescript development, If a warning comes up about Trusting the code in this folder, click yes. This is going to be your code base and we will be modifying it

How to create an Angular Model?
We are going to put the code that speaks to our C# Web API in an Angular service. Let’s call this service our TemperatureService. But before we do this lets create a typescript class that will represent our temperature log. It is going to be similar to the one we created in our C# Web API project. Hopefully you have VS Code open and showing our ‘TemperatureUI’ folder from the last section. Next, click on ‘Terminal’ on the top Menu and select ‘New Terminal’. This should open a new window at the bottom and we can carry on running commands just like we did in the ‘Command Prompt’. The Angular CLI is quiet powerful and we will let it do a lot of our work for us
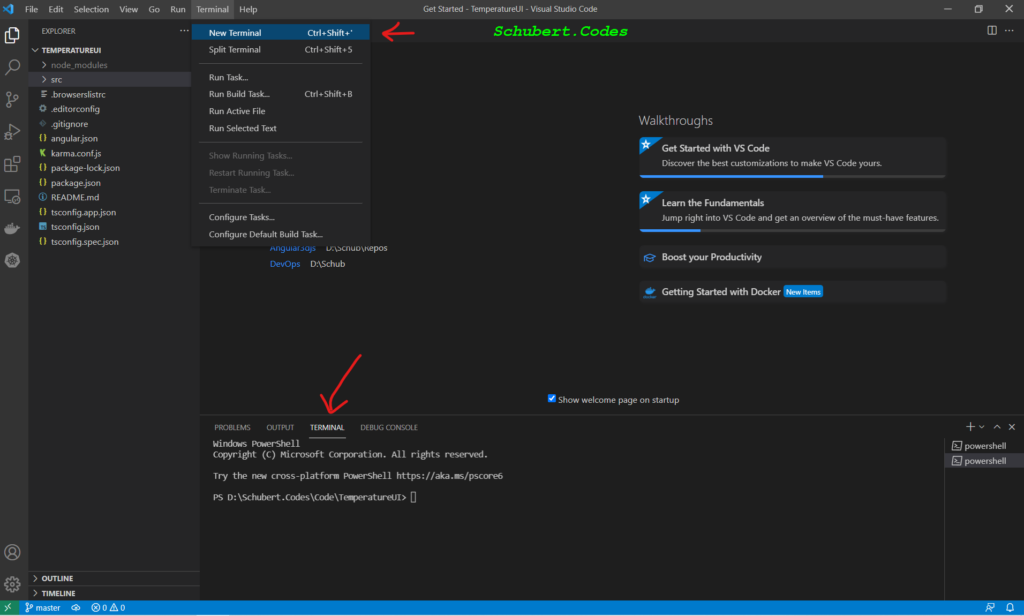
Once the terminal is open, type the below command to create our temperatureLog typescript class
ng generate class models/temperatureLog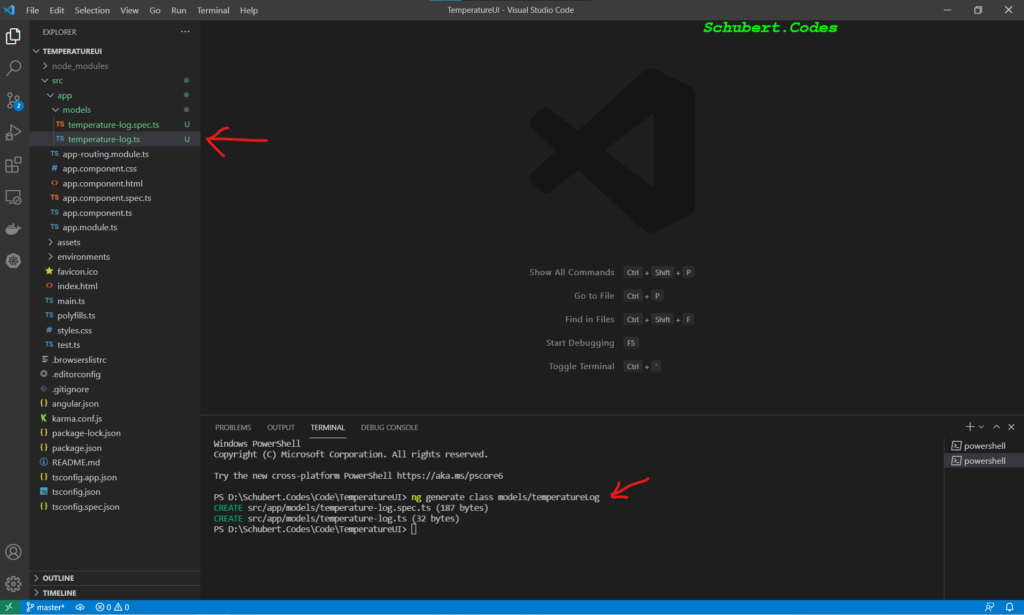
Open the TemperatureLog.ts file and update it, so it has properties similar to our TemperatureLog.cs class. It should looks like the below. You will notice that the property names are lowercase and match with the JSON attributes we put on the properties of our C# TemperatureLog.cs model. And hopefully you can see how things are going to tie together soon.
They last line [key: string] will make more sense when we get to D3.js section. It allows us to easily read any property on our Temperature Log object when we start getting temperature logs from our Web API. The constructor is a special method, it allows us to initialise our Temperature log with values. Any code in the constructor only runs one, that too right at the start when an object gets created from our class
export class TemperatureLog {
    id: number;
    deviceName: string;
    temperature: number;
    humidity: number;
    timestamp: number;

    [key: string]: any;

    constructor(id: number, deviceName: string, temperature: number, humidity: number, timestamp: number){
        this.id = id;
        this.deviceName = deviceName;
        this.temperature = temperature;
        this.humidity = humidity;
        this.timestamp = timestamp;
    }
}
How to create an Angular Service?
For now we are going to create a service that returns some fake temperature and humidity results. This is so we can build the UI part of our project quickly and not depend on the Web API just yet. But not for long, in the next blog post we will tie it all together. To create the Angular service, type the below command into the terminal and we should see our TemperatureLogService appear on the left
ng generate service services/temperatureLog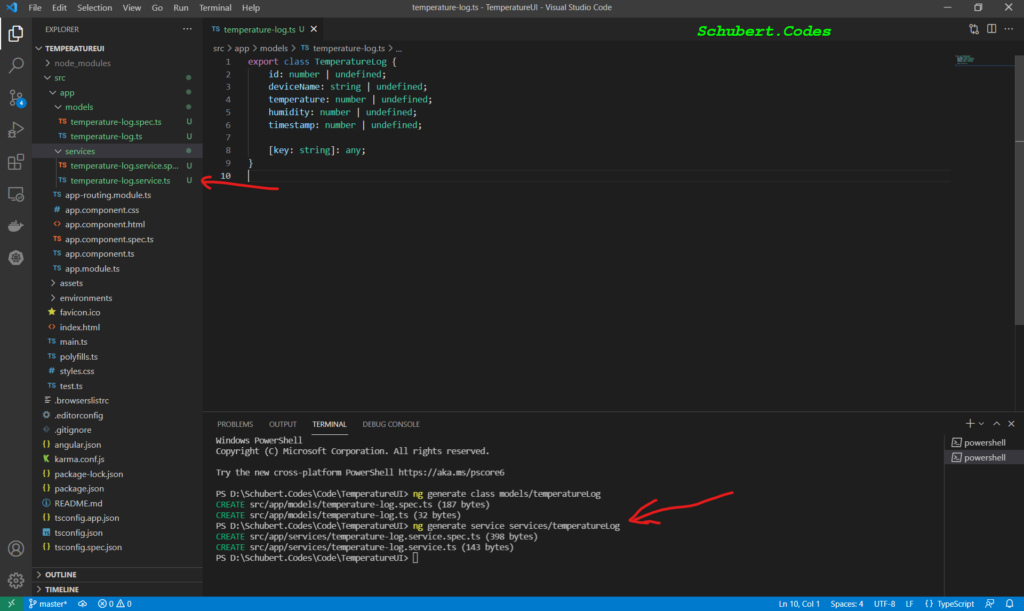
Don’t worry that the file names appear in green, this is VS Code telling us it has detected new files and has to do with version control. Git is a well know version control system and we will cover this in another blog post. In our new service class create a function called getTemperatureLogs and put some fake reading in there. I’ve put 10 reading, feel free to add more. Just make sure to use 1635555000 as your starting timestamp. So your 1st temperature log should have 1635555000 as its timestamp and then keep on adding 100 to the timestamp for every new log that you add, like I’ve done below
import { Injectable } from '@angular/core';
import { Observable, of } from 'rxjs';
import { TemperatureLog } from '../models/temperature-log';

@Injectable({
  providedIn: 'root'
})
export class TemperatureLogService {

  getTemperatureLogs() : Observable<TemperatureLog[]>{
    return of([
      new TemperatureLog(1, "device 1", 10.10, 20.20, 1635555000),
      new TemperatureLog(2, "device 1", 10.11, 20.21, 1635555100),
      new TemperatureLog(3, "device 1", 10.13, 20.23, 1635555200),
      new TemperatureLog(4, "device 1", 10.14, 20.24, 1635555300),
      new TemperatureLog(5, "device 1", 10.15, 20.24, 1635555400),
      new TemperatureLog(6, "device 1", 11.10, 22.20, 1635555500),
      new TemperatureLog(7, "device 1", 11.12, 22.25, 1635555600),
      new TemperatureLog(8, "device 1", 11.14, 22.30, 1635555700),
      new TemperatureLog(9, "device 1", 11.16, 22.35, 1635555800),
      new TemperatureLog(10, "device 1", 11.18, 22.40, 1635555900)
    ]);
  }
}
How to create an Angular Component?
Angular components are the glue between our HTML and our services. It allows us to call our Temperature Log service to get some data and then glues the data to our HTML that our website visitors can see in their browser. Usually the data is present in the HTML. Let present the temperature and humidity readings we get from our Temperature Log service using simple HTML tables. To do this run the below command to create a BarGraphComponent
ng generate component temperaturelog/barGraph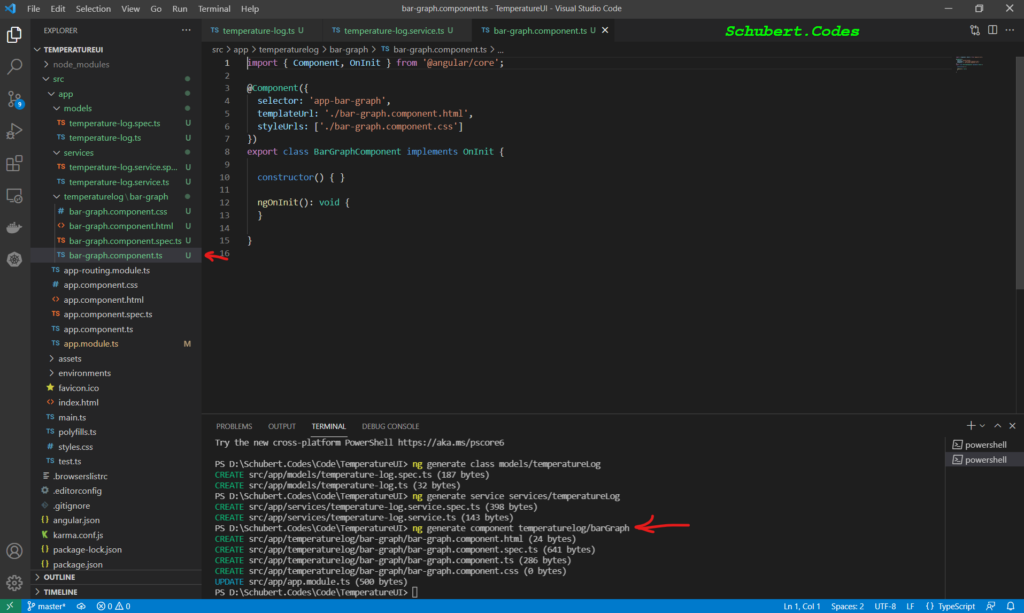
Notice that 4 files were created this time. We will focus on bar-graph.component.ts and bar-graph.component.html for now. The TS file is the JavaScript / typescript file and it will contain our code. The HTML file is the our HTML file and will contain our HTML code. Let’s update the controller to take our Temperature Log service via it’s constructor. Another good example of Dependency Injection. Your bar-graph.component.ts should look like the below code.
import { Component, OnInit } from '@angular/core';
import { Observable } from 'rxjs';
import { TemperatureLog } from 'src/app/models/temperature-log';
import { TemperatureLogService } from 'src/app/services/temperature-log.service';

@Component({
  selector: 'app-bar-graph',
  templateUrl: './bar-graph.component.html',
  styleUrls: ['./bar-graph.component.css']
})
export class BarGraphComponent implements OnInit {

  logs$: Observable<TemperatureLog[]> | undefined;

  constructor(private temperatureLogService: TemperatureLogService) { }

  ngOnInit(): void {
    this.logs$ = this.temperatureLogService.getTemperatureLogs();
  }
}
We have a logs$ property that holds all the reading that the Temperature Log Service gives us. We can then update our bar-graph.component.html file to show the logs in our browser. Update your html to look like the below
<table>
    <thead>
        <tr>
            <td>Id</td>
            <td>Device Name</td>
            <td>Temperature</td>
            <td>Humidity</td>
            <td>Timestamp</td>
        </tr>
    </thead>
    <tbody>
        <tr *ngFor="let temperatureLog of logs$ | async">
            <td>{{temperatureLog.id}}</td>
            <td>{{temperatureLog.deviceName}}</td>
            <td>{{temperatureLog.temperature}}</td>
            <td>{{temperatureLog.humidity}}</td>
            <td>{{temperatureLog.timestamp}}</td>
        </tr>
    </tbody>
</table>
Now that our component code and HTML is ready, we need to tell Angular when to show us our new component. We are going to do this using Angular Routing. So we will tell Angular when someone browses to “http://localhost:4200/temperature-log-bar-graph” to show them our Temperature Log component. During the setup we said yes to routing, this adds a routing file to our project. This makes adding a new route very easy. Locate “app-routing.module.ts” and update it to the below
import { NgModule } from '@angular/core';
import { RouterModule, Routes } from '@angular/router';
import { BarGraphComponent } from './temperaturelog/bar-graph/bar-graph.component';

const routes: Routes = [
  { path:'temperature-log-bar-graph', component: BarGraphComponent }
];

@NgModule({
  imports: [RouterModule.forRoot(routes)],
  exports: [RouterModule]
})
export class AppRoutingModule { }
Time to see our new component in action. In the Terminal type and run the “npm start” command. The will compile our code and start up the Angular Development Server. Browse to “http://localhost:4200/temperature-log-bar-graph” and scroll down. We should hopefully see our reading

Press CTRL + C in the terminal window and we can finally get on to the cool part … the pretty graphs using D3.js
How to install and use D3.js in our Angular project?
In the Terminal run the below commands. This should install D3.js and it’s types in our project
npm install d3
npm install @types/d3 --save-dev
Now let’s update our bar-graph code and HTML to used D3.js. The HTML an easy update, so lets deal with that first. Update your bar-graph.component.html to the below. The figure HTML elements is where D3.js is going to put our temperature and humidity graph. D3.js is going to use SVG under the hood to plot our graphs
<h2>Temperature Chart</h2>
<figure id="temperature"></figure>
<h2>Humidity Chart</h2>
<figure id="humidity"></figure>
Next we need to update our bar-graph.component.ts to the below. I’ve put comments in the code so it is easy to understand what we are doing. Hopefully it is easy to follow
import { Component, OnDestroy, OnInit } from '@angular/core';
import * as d3 from 'd3';
import { Subscription } from 'rxjs';
import { tap } from 'rxjs/operators'
import { TemperatureLog } from 'src/app/models/temperature-log';
import { TemperatureLogService } from 'src/app/services/temperature-log.service';

@Component({
  selector: 'app-bar-graph',
  templateUrl: './bar-graph.component.html',
  styleUrls: ['./bar-graph.component.css']
})
export class BarGraphComponent implements OnInit, OnDestroy {

  // A variable to keep our get temperature logs subscription
  getTemperatureLogsSubscription: Subscription | undefined;

  // A variable for the space around our graph
  private margin = 80;
  // A variable for the width of our graphs
  private width = 1050 - (this.margin * 2);
  // A variable for the height of our graphs
  private height = 400 - (this.margin * 2);

  // The bar graph component constructor
  // where we inject our TemperatureLogService
  constructor(private temperatureService: TemperatureLogService) {
  }

  // This code is run when our component start gluing our HTML
  ngOnInit(): void {
    // create the skeleton SVG for temperature and humidity graph
    // these SVGs will be used to draw our graphs
    let tempSVG = this.createSvg("temperature");
    let humiditySVG = this.createSvg("humidity");

    // We are calling our temperature service to get our temperature logs
    // and we are saving that subscription in a variables, so we can tell the browser to
    // free the memory space when we no longer need the data
    this.getTemperatureLogsSubscription = this.temperatureService.getTemperatureLogs()
    .pipe(
      // plot our temperature graph
      tap((logs) => this.drawBars(tempSVG, "temperature", logs)),
      // plot our humidity graph
      tap((logs) => this.drawBars(humiditySVG, "humidity", logs))
    ).subscribe();
  }

  // This code is run when our component is done and we no longer needed it
  ngOnDestroy(): void {
    // we are unsubscribing here to free up memory
    this.getTemperatureLogsSubscription?.unsubscribe();
  }

  // This code will create our blank SVG in our HTML
  private createSvg(type: string): d3.Selection<SVGGElement, unknown, HTMLElement, any> {
    return d3
      //find our figure HTML element using the type parameter
      .select(`figure#${type}`)
      // create a SVG HTML element inside of it
      .append("svg")
      // set the SVG's width
      .attr("width", this.width + (this.margin * 2))
      // set the SVG's height
      .attr("height", this.height + (this.margin * 2))
      // make a place to draw our graph
      // Just to clarify, we are going to draw our graph later when we get the data from our C# Web API
      // but we are making a place for it now. So right now we are making a HTML element called 'g'
      // inside our SVG which is inside our figure, the bars will get drawn here
      .append("g")
      // adjust the position of our graph in the SVG
      .attr("transform", "translate(" + this.margin + "," + this.margin + ")");
  }

  // This code will draw the bars in our graph
  private drawBars(svg : any, type: string, data: TemperatureLog[]): void {
    // D3.js is going to help us map our timestamps to the x-axis
    const x = d3.scaleBand()
      // we tell D3.js how much width we have for our graph
      .range([0, this.width])
      // we tell D3.js the timetamp values in our data, so it can adjust the width
      .domain(data.map((d : TemperatureLog) => d.timestamp.toString()))
      // leave a gap between the bars on the x-axis
      .padding(0.2);

    // Draw the x-axis on the SVG
    svg.append("g")
      // move our x-axis text down to the bottom of the graph
      .attr("transform", "translate(0," + this.height + ")")
      // call D3.js to get our x-axis values
      .call(d3.axisBottom(x))
      // select all our x-axis text
      .selectAll("text")
      // rotate them so they look cool
      .attr("transform", "translate(-10,0)rotate(-45)")
      // move the text even lower, so the whole value is visible
      .style("text-anchor", "end");

    // put all our reading of type parameter in an array called readings
    // so readings array will be filled with our temperature readings when we type is temperature
    // and readings array will be filled with our humidity readings when we type is humidity
    var readings = data.map(d => d[type]);

    // D3.js is going to help us map our reading to the y-axis
    const y = d3.scaleLinear()
      // we tell D3.js how much height we have for our graph
      .range([this.height, 0])
      // we tell D3.js the reading values in our data, so it can adjust the height
      .domain([Math.min(...readings) - 0.5, Math.max(...readings) + 0.5]);

    // Draw the Y-axis in the SVG
    svg.append("g")
      // call D3.js to get our y-axis values
      .call(d3.axisLeft(y));

    // Create and fill the bars
    svg.selectAll("bars")
      .data(data)
      .enter()
      .append("rect")
      .attr("x", (d : TemperatureLog) => x(d.timestamp.toString()))
      .attr("y", (d : TemperatureLog) => y(d[type]))
      .attr("width", x.bandwidth())
      .attr("height", (d: TemperatureLog) => this.height - y(d[type]));

    // Put the reading above each bar, so it is easy to see the reading
    svg.selectAll("bars")
      .data(data)
      .enter()
      .append("text")
      .attr("x", (d : TemperatureLog) => x(d.timestamp.toString()))
      .attr("y", (d : TemperatureLog) => y(d[type]) - 20)
      .text((d: TemperatureLog) => d[type]);
  }
}
Finally
All the hard work is done, we just need to run our Angular project and we should see two graphs. In your terminal run “npm start”, browse to “http://localhost:4200/temperature-log-bar-graph” and scroll to the bottom of the page
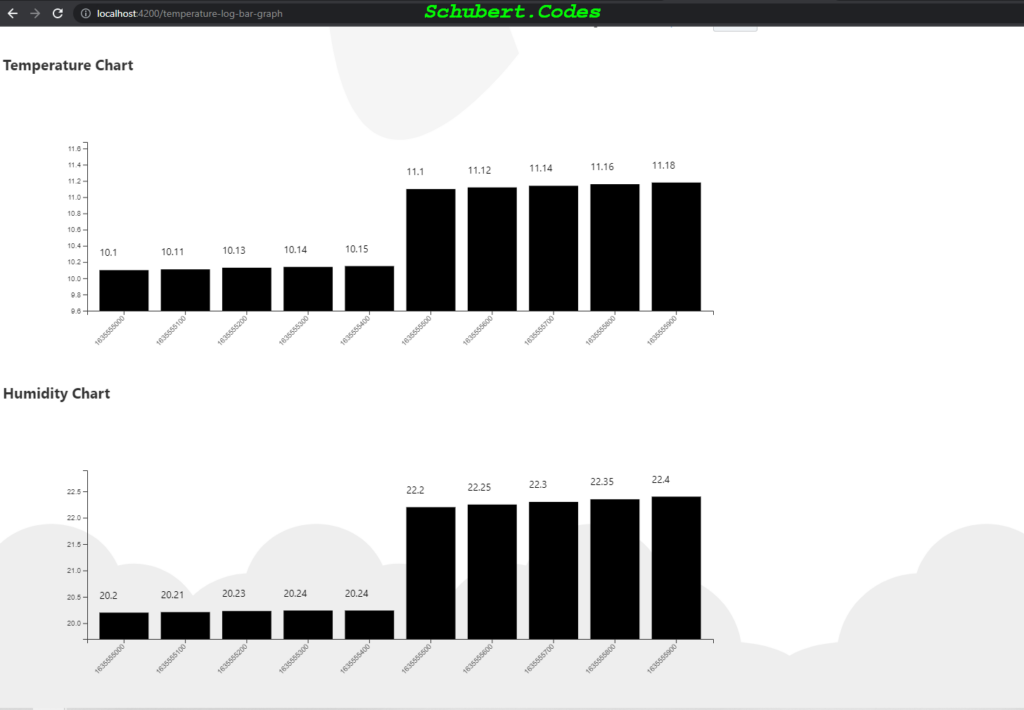
We achieved a lot this time around too. So far, we have managed to get temperature and humidity readings from an Arduino Wifi, but it is POSTing them to a public server, not our Web API. Also these reading are not being saved anywhere. We have a C# Web API project that is saving and restoring readings in Azure Cosmos DB Emulator, but it is not saving and restoring our readings from our Arduino. And we now have an Angular project that plots cool graphs using D3.js, but our service has test data. In the next blog we will connect these 3 pieces together and make the graph colourful too. Till next time, Happy Coding!
